A free online tool for evaluating comfort according to ASHRAE Standard 55.
Status: Current
Funding Sources: CBE Industry Consortium
Project Objective
Develop a web-based graphical user interface for thermal comfort prediction according to ASHRAE Standard 55. Include models for conventional building systems (predicted mean vote) and also for comfort using the adaptive comfort model, and with increased air speeds (for example, when using fans for cooling). Provide ongoing upgrades and new features, such as visualization of comfort boundaries within the psychrometric and temperature-humidity charts, and automatic generation of LEED documentation for thermal comfort credits.
Project Results
This online tool has been online and freely since 2013, and is being regularly updated with enhancements, and to include approved changes to the ASHRAE 55 Standard. We have provided these video tutorials to explain its use:
This powerful online tool was first launched in 2013 and is used by close to 50,000 users annually.
Significance to Industry
In the design and operation of buildings and mechanical systems, an advanced understanding of human comfort presents opportunities to save energy and increase thermal comfort. The standard convention of attempting to maintain a narrow temperature band can be an energy-intensive practice. Instead, using CBE’s comfort prediction tools with ASHRAE Standard-55 as a guide, designers may find that a wider temperature band will provide adequate comfort and save a significant amount of energy. In other cases, the tool can be used to assess the comfort of low-energy designs.
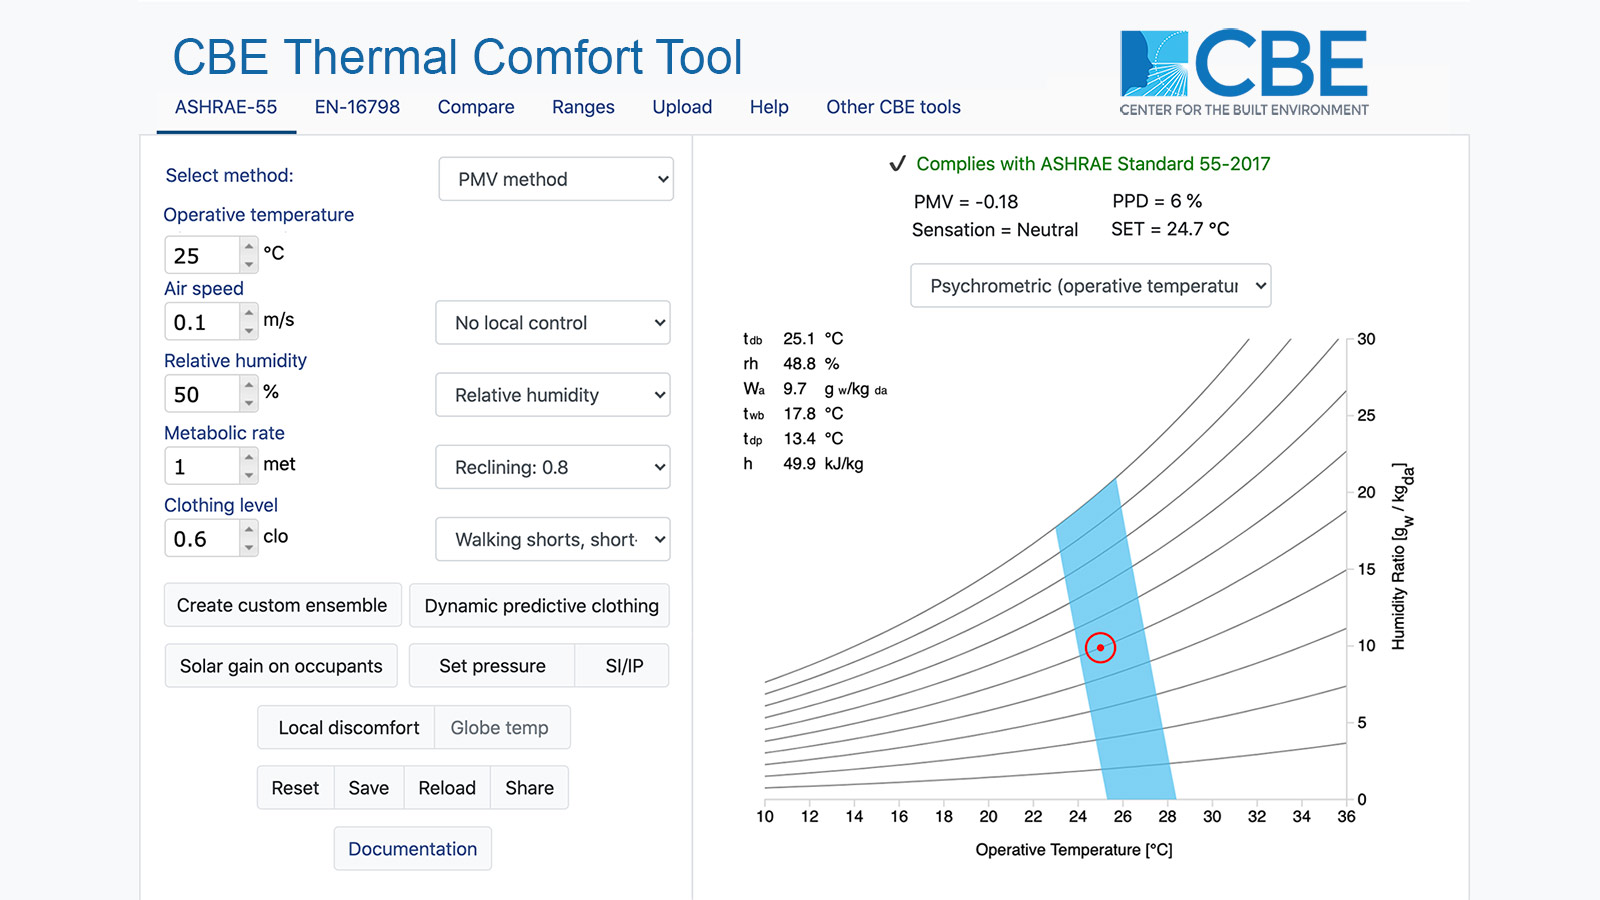
A building that has provisions for air movement (such as ceiling fans or desk fans) can use the predicted mean vote (PMV) model with elevated airspeed. In a naturally ventilated building, the adaptive comfort model can be used. This tool provides options for both of these system choices, verifying compliance with ASHRAE Standard 55-2017.
Research Approach
Most recently we have added a number of features that are important for practitioners. These include the ability to compare two or three thermal comfort scenarios, using the comparison tab on the tool. We also provide the ability to plot how the comfort area changes in the psychrometric chart when clothing, metabolic activity, air velocity or mean radiant temperature are varied within a given range, using the ranges tab. Users can upload time-series, or large sets of input parameters and it automatically calculates PMV, PPD, SET, and CE. This allows users to perform exceedance predictions (annual or seasonal) for simulated or real buildings.
Publications and Reports
Tartarini, F., S. Schiavon, T. Cheung and T. Hoyt. 2020. CBE Thermal Comfort Tool: Online tool for thermal comfort calculations and visualizations. SoftwareX Volume 12, July–December 2020. https://www.sciencedirect.com/science/article/pii/S2352711020302454
Schiavon, S., T. Hoyt and A. Piccioli. 2013. Web application for thermal comfort visualization and calculation according to ASHRAE Standard 55. Building Simulation, Volume 7, Issue 4, 321- 334. http://escholarship.org/uc/item/4db4q37h
Hoyt, T., K.H. Lee, H. Zhang, E. Arens, and T. Webster. Energy savings from extended air temperature setpoints and reductions in room air mixing. Proceedings, International Conference on Environmental Ergonomics, 2009. http://escholarship.org/uc/item/28x9d7xj
Schiavon, S., and A.K. Melikov. Energy saving and improved comfort by increased air movement. Energy Build. 2008. http://www.escholarship.org/uc/item/6xg815xj