Interactive thermal comfort tools for data visualization and query building.
Use the interactive visualization tool
Status: Completed
Funding Sources: ASHRAE CBE Industry Partners
Project Objective
Create a suite of resources that would take advantage of a global database of thermal comfort data, allowing others in industry to visualize and analyze field study data to improve building design.
Project Results
A new suite of free and publicly available online resources has been launched to facilitate academic and professional studies of thermal comfort in buildings, the result of a four-year effort led by the Center for the Built Environment at UC Berkeley and the University of Sydney’s Indoor Environmental Quality Laboratory. These tools can be used to inform questions about thermal comfort, and to encourage the design of climate-responsive and comfortable low energy (and ZNE) buildings.
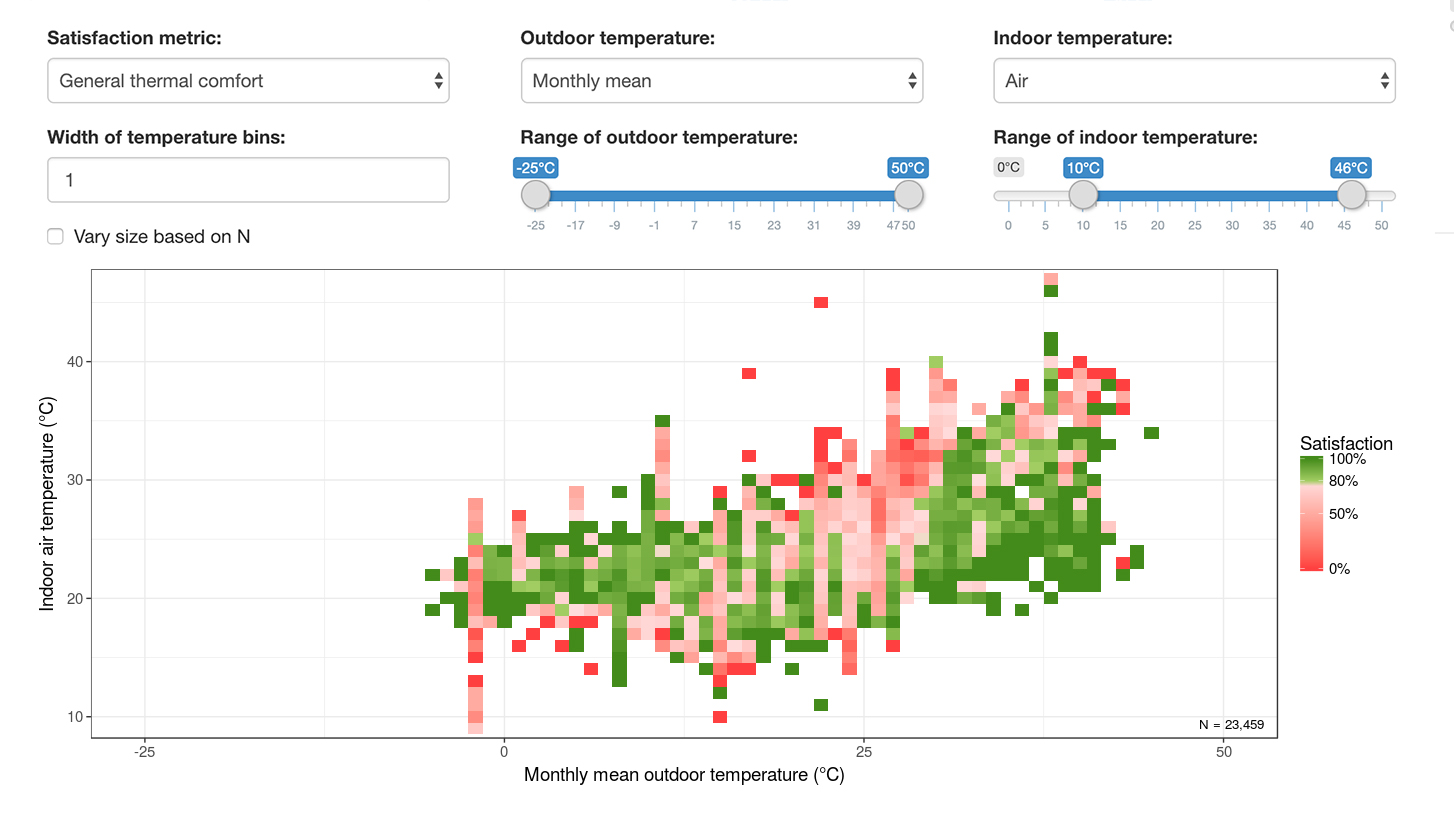
Interactive Visualization Tool
The visualization tool is a powerful and user-friendly interface for researchers and practitioners to explore and navigate their way around the large volume of data. The interface is divided into three pages to examine satisfaction scores, adaptive comfort, and other variables, using preset boxplots, bar charts and scatter plots that enable rapid data visualization and analysis. The tool is online here.
Data and Documentation
Design practitioners and others who are more proficient in Excel or other numeric/statistical software can perform their own analyses by downloading the database or a subset by using the Dryad repository or the Github repo for the data and documentation. Instructions are also provided for people who would like to contribute data.
Significance to Industry
This work serves a fundamental goal of CBE’s research consortium: to make key research findings available to industry and to provide actionable insights that improve building design and operation. The database holds findings from research conducted over two decades, created in collaboration with over 60 contributors around the world who released their raw data for wide dissemination. It includes 107,000 rows of data, pairing subjective ‘right-here-right-now’ comfort responses with environmental measurements relevant to thermal comfort. In addition to being an impressive body of collaborative data collection (the largest thermal comfort database to date), the project team created interactive and downloadable resources for both industry practitioners and researchers.
Research Approach
The project team conducted significant outreach and international collaboration to assemble into a single repository almost all of the scientifically rigorous field study datasets available at that time (about 22,000 questionnaire responses with accompanying instrumental measurements). The research team built on the results of a previous ASHRAE project (described below). These results greatly expanded this effort, both in terms of including data collected in the years since, and also taking advantage of our new ability to create online tools which facilitate the use of this data. The work was supported by the ASHRAE grant, ‘Global Thermal Comfort Database II.’ The project was co-funded by additional sources, including CBE partners.
A previous project, ASHRAE RP-884 ‘Thermal Comfort Database I’ was compiled in the late 1990s for the purpose of testing the adaptive thermal comfort hypothesis and developing a new model based on this. In 2004 the resulting model went on to form the empirical basis of ASHRAE’s adaptive thermal comfort standard for occupant-controlled, naturally conditioned spaces (ASHRAE Standard 55). This first iteration brought together high-quality measurements of indoor thermal environments and simultaneous subjective thermal comfort evaluations from 52 field studies conducted in 160 buildings worldwide, mostly commercial offices, from 1982 to 1997.
Publications and Reports
Földváry Ličina, V., Cheung, T., Zhang, H., de Dear, R., Parkinson, T., Arens, E., … Andamon, M., et al., 2018. Development of the ASHRAE Global Thermal Comfort Database II. Building and Environment, September. https://www.sciencedirect.com/science/article/pii/S0360132318303652?via%3Dihub
The full database and user notes associated with the Query Builder tool are available from this UC Berkeley hosting site.