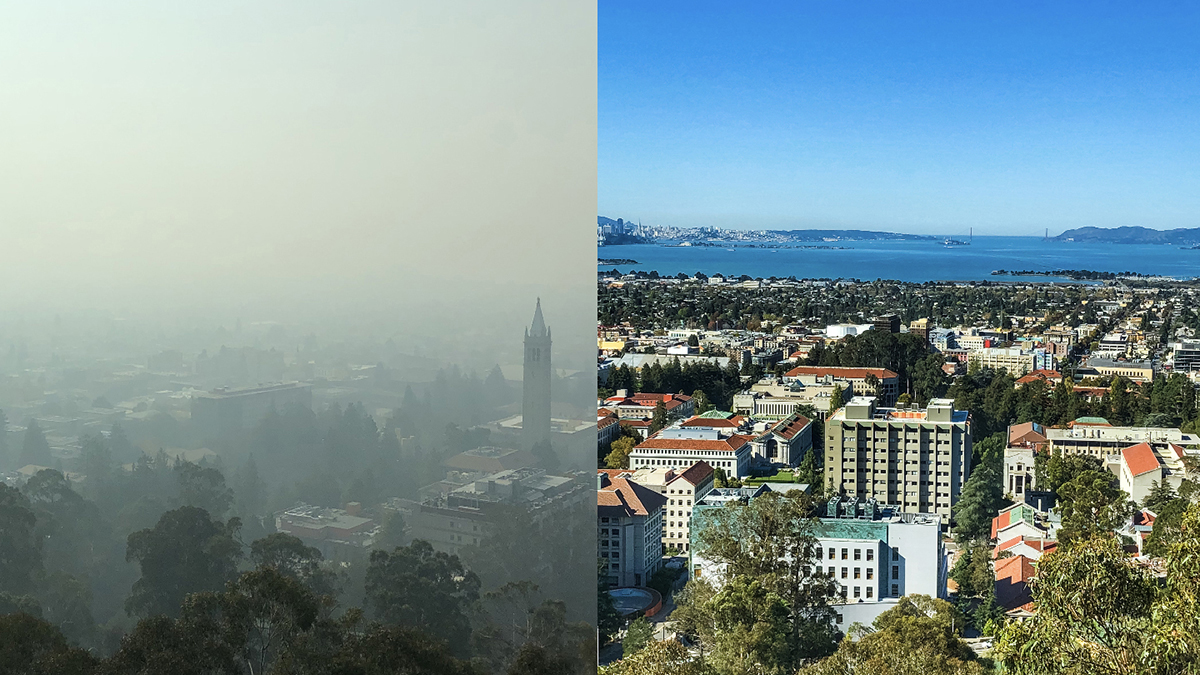
In November of 2018, a deadly and destructive wildfire raged for weeks in Northern California, destroying entire communities and killing over 85 people. The fire continued for two weeks until winter rains helped to squelch the blaze, during which time a plume of wildfire smoke spread across California, blanketing vast areas in dense grey smoke. In the San Francisco Bay Area, people hunkered down in homes and workplaces, schools were closed, and people were advised for many days to limit time outdoors.
Wildfire smoke is a toxic soup that may contain carbon dioxide, carbon monoxide, particulate matter (PM), complex hydrocarbons, nitrogen oxides, trace minerals, and many other compounds. Exposure to such smoke is associated with chronic and acute respiratory and cardiac issues. Studies have also shown that exposure to wildfires during pregnancy may impact birth weight among term infants, and increases in mental health symptoms among adolescents.
While the health risks are clear, few standards currently exist for protecting building occupants from pollution caused by wildfires; standards such ASHRAE 62.1 and 62.2 only address normal outdoor air conditions. A few documents provide general guidance: Wildfire Smoke Response Planning by the British Columbia Center for Disease Control, and Wildfire Smoke Guidelines from the California Department of Public Health. However, these provide only very general recommendations such as “reduce infiltration” or installing “effective filters.” Such qualitative statements reveal the lack of resources to quantify these building properties.
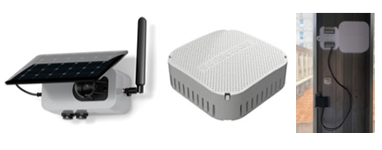
Sensors used: outdoor PM2.5 monitor (left); indoor PM2.5 monitor (center); and window sensor (right).
In March 2018, the research team at CBE installed low-cost Internet of Things (IoT) PM2.5 sensors on the roofs of two UC Berkeley buildings, along with 14 indoor sensors in each building. During the 2018 fires (November 8–November 21), these sensors enabled us to understand and evaluate building resilience to urban scale air pollution, quantifying particle penetration to the indoors from outdoors. The sensors were accompanied by a survey of the building occupants, with questions focused on changes in their behavior, perceived air quality, self-reported productivity and health symptoms. The buildings included one naturally ventilated and one mechanically ventilated, both located in Berkeley, CA.
1608 4th Street Building: This is a mechanically ventilated building with a centralized HVAC system. The HVAC system utilizes three stages of air filtration: (1) a Minimum Efficiency Reporting Value (MERV) 8 pleated filter; (2) gas phase filter; and (3) a high-efficiency MERV 13 filter. Measurements of CO2 showed that building is airtight, indicating that infiltration plays a minor role in bringing outdoor pollution indoors.
Wurster Hall: This is a mixed-mode operated building, with the east wing naturally ventilated with a high level of infiltration. During normal operation, the building usually has CO2 levels below 550 ppm indicating good exchange with the outdoors (typically 400 ppm).
Indoor air quality during an air pollution episode
Using an IoT sensing network enabled us to understand the overall building operation in the context of indoor and outdoor PM2.5 levels. Results in Figure 1 show that the median hourly indoor PM2.5 concentration over the entire wildfire event was 21 μg/m3 for the building on 4th Street, and 36 μg/m3 for Wurster Hall. Measured CO2 decay rates, indicating infiltration of 0.15 air changes per hour (ACH), suggest that 4th Street is airtight, showing that the ingress of PM2.5 through mechanical ventilation was the most dominant mechanism of PM2.5 penetration into the building.
Wurster Hall has operable windows designed to allow the natural flow of air through the building, and although monitored windows were closed (based on contact sensor readings) during the pollution event Wurster Hall had infiltration of 0.40ACH.
Our measurements enabled us to calculate an indoor to outdoor (I/O) particle ratio as one of the key performance measures of the building. The I/O ratio will tell us how much outdoor pollution penetrated into the building. For the entire period, the I/O ratio for the 4th Street building was 0.27, while for Wurster Hall I/O was 0.67. Results from Figure 1 and calculated I/O represent overall operation of the building during the entire pollution episode, but that does not tell us much about the day-to-day operation, nor will it tell us how these levels of pollution impacted building occupants. Results as shown in Figure 1 tell us that the 4th Street building is more resilient to extreme pollution events than Wurster Hall.
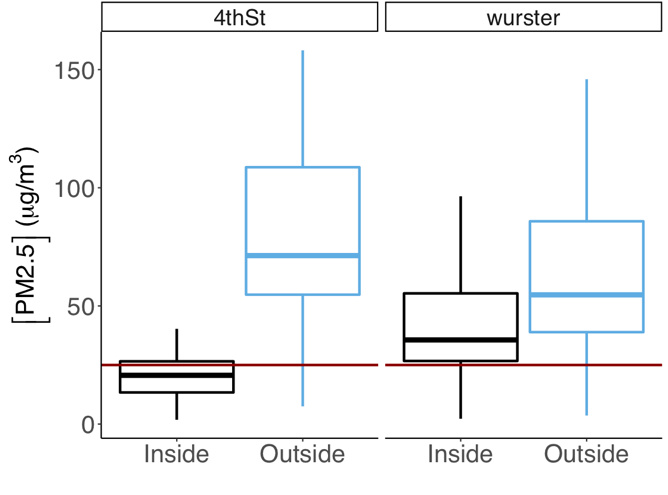
Figure 1: Comparison of hourly PM2.5 concentrations between the two sites for the entire period of air pollution episode. The box plot represents the 25th percentile, median, and 75th percentile, and the whiskers represent the 5th and 95th percentiles. The red line shows the WHO air quality guideline threshold.
Occupant exposure to pollutants
Health, productivity and comfort of building occupants are affected by the PM2.5 concentration and the amount of time occupants were exposed. In order to evaluate this in the context of building resilience, we simultaneously evaluated ambient concentration and exposure time. We compared the hourly median PM2.5 concentration to the World Health Organization (WHO) 24-hour exposure guidelines and calculated the exceedance index (E-index).
Results in Figure 2 show that 4th Street’s E-index was below the WHO suggested threshold 66% of the time, compared to only 23% of the time for Wurster Hall. We calculated the overall average E-index by taking the average of the hourly values for the entire pollution episode. This could also be done only considering occupied hours. The overall E-index for 4th Street is 0.82, suggesting that the building was resilient to air pollution and that filtration with the MERV 8 and MERV 13 filters was able to reduce the PM2.5 penetration to maintain normal operation inside the building. For Wurster Hall, the average E-index was 1.69, suggesting that air quality conditions could potentially have severe consequences on those with pulmonary health issues.
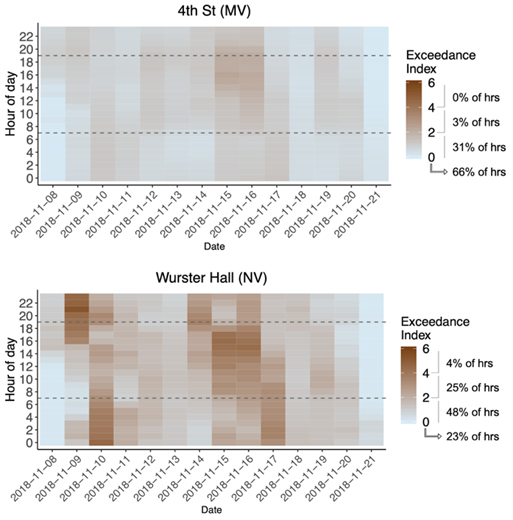
Figure 2: Exceedance index PM2.5 heat map calculated for WHO 24 hour exposure guidelines at 4th Street (top) and Wurster Hall (bottom).
Conclusion and future
While we cannot make broad generalizations from this small study, we did observe trends to better understand and quantify building performance in extreme pollution events. Future studies should be scaled up to a larger cohort of buildings. Unfortunately, such fire events are expected to be more likely due to climate change and continued development in forested areas.
As the types of IoT sensing systems we used in this study are becoming more common in the construction and building industry, we hope to find opportunities to collaborate with CBE industry partners and others to explore future studies of this type. Our goal is to develop analytical tools and sensor deployment strategies that can be used to map out buildings that are safe for people to occupy during extreme air pollution events, and to identify which interventions are most effective. Such systems might also offer the ability to provide information for planning and in real-time to identify buildings that can serve as clean-air shelters during future fire events.
Featured image: A view of the San Francisco Bay on Nov. 14, 2019 (left) and three weeks prior. (Berkeley Lab / Kelly J. Owen)