An online climate analysis and visualization resource.
Status: Completed
Funding Sources: CBE membership income
Project Objective
The primary objective of this work was to develop an easy-to-use online tool that transforms freely available weather data into an understandable set of graphics that may be tailored to the needs of the environmentally conscious building designers and other stakeholders.
Project Results
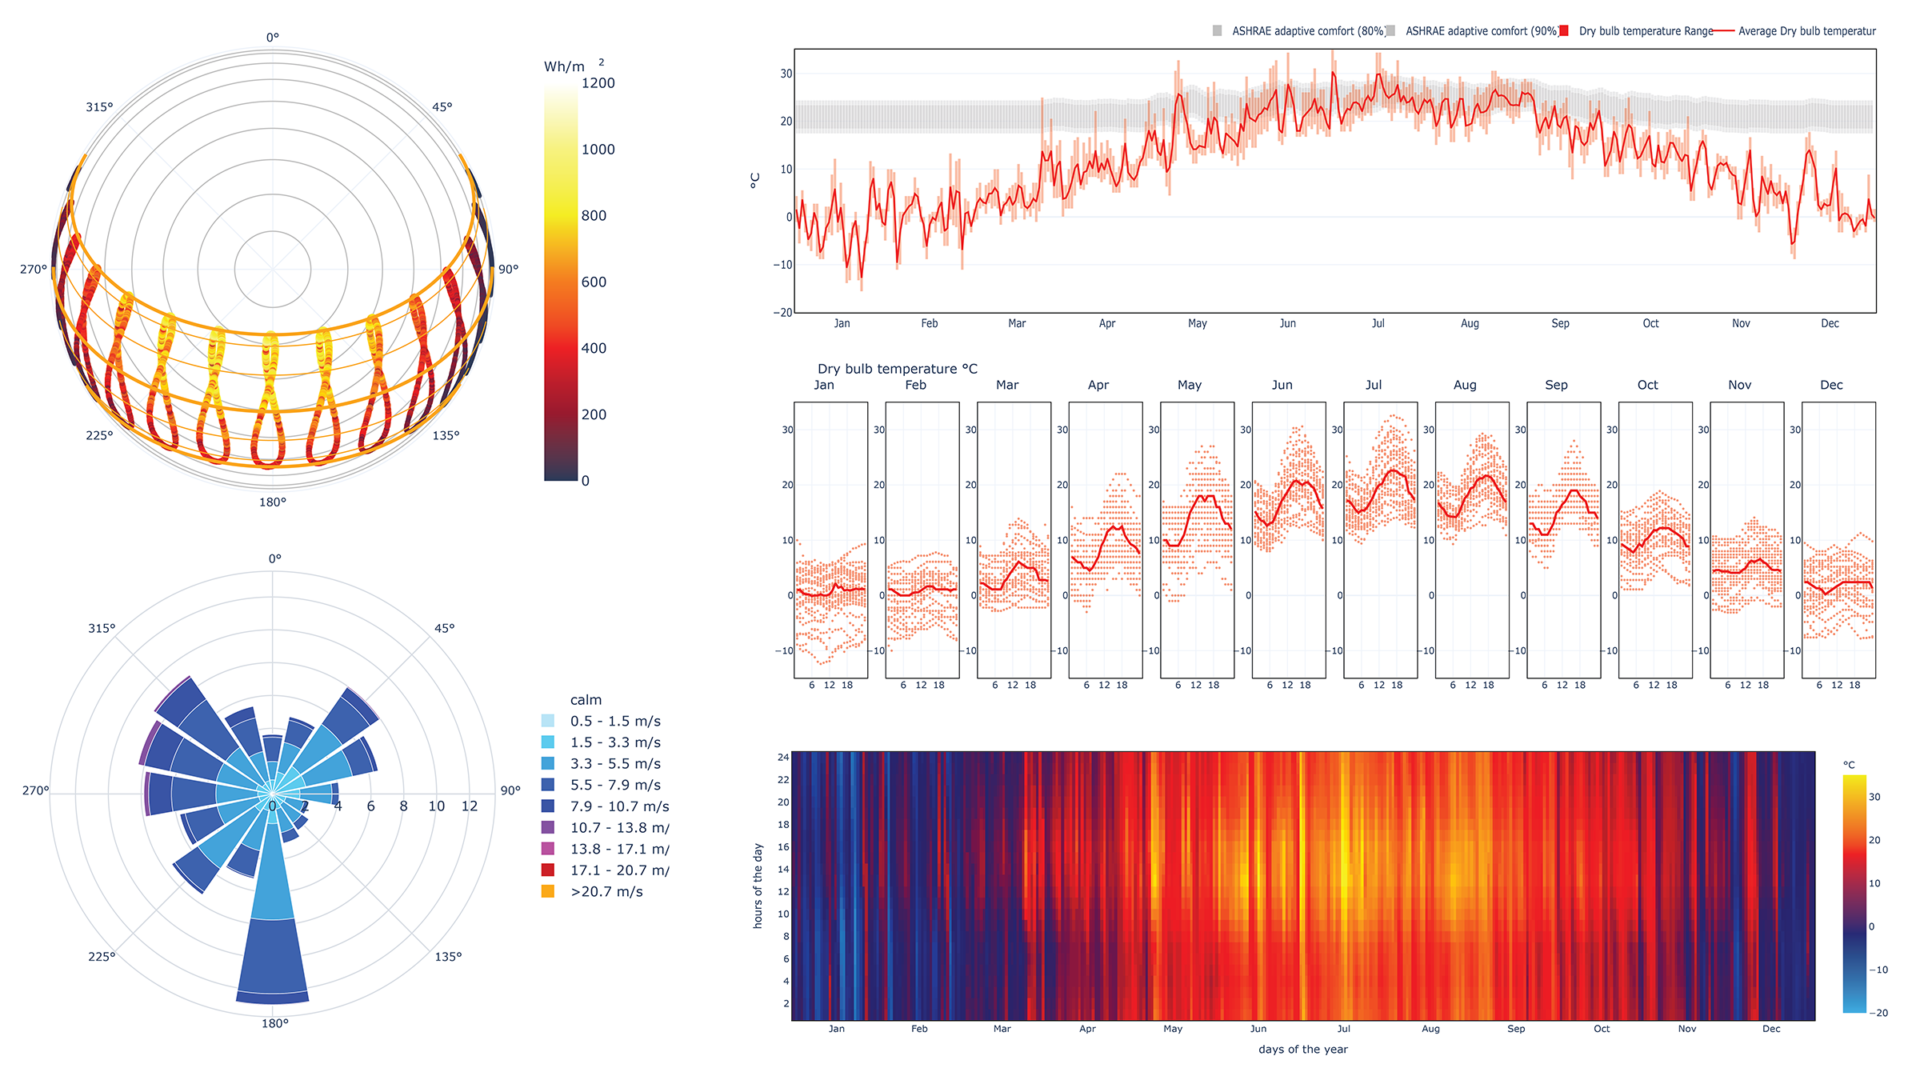
This site went live during the summer of 2021, and quickly gained thousands of users. CBE Clima gives easy access through an interactive map to ~30,000 high-quality weather files for building performance simulation worldwide.
Clima converts weather data from around the world to a comprehensive set of high-quality, easy to understand graphics that can be tailored to the needs of the environmentally conscious building designers and other stakeholders.
Significance to Industry
Environmental design benefits greatly from having a thorough understanding of a site’s local climate. Advanced design firms typically make a significant time investment to create climate graphics that explain to project stakeholders the possibilities and challenges of a specific climate. Currently the industry relies largely on specialist tools such as the environmental plugins Ladybug and Honeybee. While those tools are extremely versatile, they are not immediately accessible to non-experts, and little or no guidance on the interpretation of the results is available. For design offices that lack such expertise, making use of the information contained in available weather data is often impossible. This project aims to serve a wide range of design practices, enabling the creation of high quality, downloadable climate graphics that can explain and communicate the data contained in EPW files to a wide range of project team stakeholders.
Research Approach
This project takes advantage of freely available weather data from thousands of locations around the world that are available from many sources. Previous work at CBE created a proof-of-concept web application to extract, analyze and visualize relevant climatic information contained in industry standard EnergyPlus weather (EPW) format. Building on that preliminary effort, we identified a set of climate variables and their relevant graphical representations to convey simple and actionable information about a particular climate that can be shared with multiple project stakeholders.
This tool includes an interactive world map that gives access to approximately 30,000 freely available weather files worldwide.The data are sourced from the Department of Energy weather data and OneBuilding.org. It also allow a user to upload proprietary or other weather files. The tool uses graphs produced using the open-source graphing library Plotly and served using Dash. In the calculation of many variables derived from those contained in EPW files, this tool takes advantage of the open-source library PyThermalComfort also developed by CBE.
The project team has worked to create a production-ready tool that allows the download of high-quality vector graphics in SVG format, to be either directly incorporated in reports or further processed with tools such as Adobe Illustrator and others. The project team is currently working on comprehensive documentation of the tool. Further work includes the creation and inclusion of predictive future weather files based on global climate models to incorporate the effects of climate-induced global heating. The technical development was supported by Christine Nguyen and Federico Tartarini.
Publications and Reports
Betti, G., Tartarini, F., Nguyen, C. et al., (2023). CBE Clima Tool: A free and open-source web application for climate analysis tailored to sustainable building design. Building Simulation https://doi.org/10.1007/
s12273-023-1090-5