An international team of researchers led by UC Berkeley’s Center for the Built Environment (CBE) has devised a new method for evaluating thermal comfort inside buildings over extended periods of time. The new index, one of many created and tested by the team, has been demonstrated to be a significant improvement over existing indices being used in building design and operation.
Evaluating thermal comfort in office buildings traditionally relies on point-in-time surveys and measurements. However, long-term evaluations are better indicators of our perception of comfort because we frequently experience a building’s indoor environment for a long period of time. Indices to assess long-term occupant thermal comfort are used by both designers (prediction) and operators (evaluation) to understand the thermal performance of a building. These are based on temperature measurements or steady-state models, however, none of these indices have been tested in real buildings, and many rely on the predicted mean vote (PMV) and predicted percentage dissatisfied (PPD). These approaches persist in building standards despite the fact that recent studies show they have low accuracy.
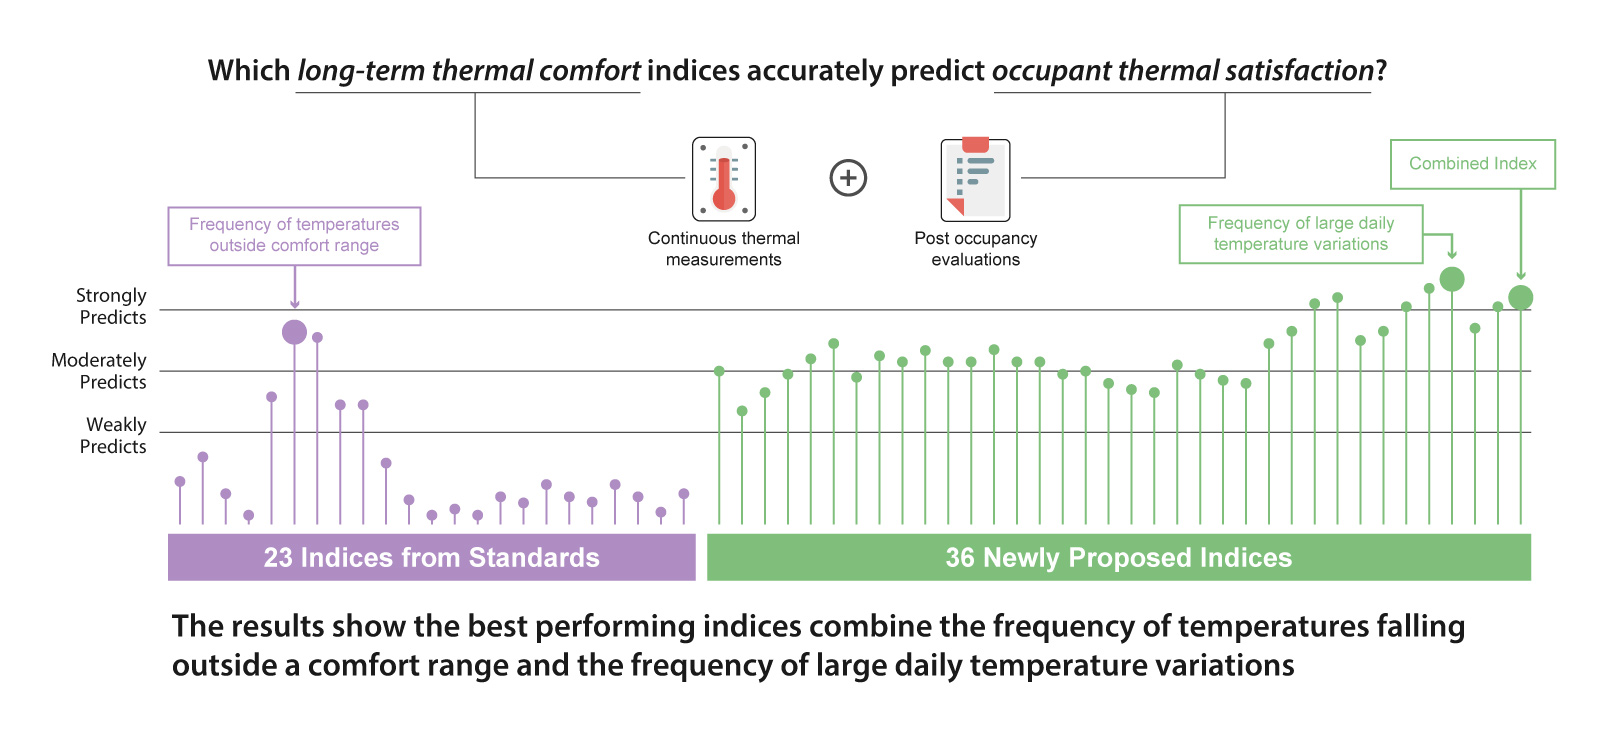
Our research team set out to evaluate long-term thermal comfort indices using datasets from office buildings in Sydney, Australia. In our recent paper, we combined 2.5 million continuous temperature measurements with approximately 1000 occupant surveys to explore the relationship between the six index types (23 total) found in standards and the thermal satisfaction of occupants. We also created and tested four new index types (34 total) based on mean temperatures, temperature ranges for percentage-hour and degree-hour, temperature variances, and daily temperature range outliers.
The findings reveal that the indices used in international standards had a weak relationship with the long-term thermal comfort of occupants. Indices with the weakest relationship to occupant comfort were based on the widely used PMV/PPD metrics. Of the existing indices, those that relied on seasonal temperature ranges had the strongest relationship to occupant comfort. In contrast, our new indices had mostly moderate or strong relationships to long-term occupant comfort. Indices based on mean temperatures did not perform well, but calculating the time where temperature exceeded a daily percentile range had the highest correlation with survey responses.
We combined the best existing index with the best new index to arrive at our proposed method for evaluating long-term thermal comfort using continuous measurements. This metric relies on two simple calculations:
- The percentage of measurements outside a temperature range of 73-79°F in summer and 68-75°F in winter.
- The percentage of measurements exceeding a daily temperature range of 3.6°F.
The performance of this index was excellent, with a final correlation coefficient of 0.71 indicating a strong relationship to measured occupant comfort. This suggests that long-term comfort is shaped by large variations outside acceptable seasonal temperature ranges rather than mean temperatures. We also tested different inputs to the index and found that air temperature had similar performance as operative temperature.
Our results show that approaches to estimating long-term thermal comfort found in international standards do not reliably assess thermal satisfaction in office buildings. Our new method outperforms all of the existing indices while simplifying the necessary inputs. We believe this is currently the best method for long-term thermal comfort assessments. The simple input and calculations of our index allows building designers and operators to leverage continuous temperature measurements from either simulations or building management systems to evaluate the long-term comfort of occupants.